


I was recently motivated to write an op ed about how the carbon footprint of commuting generally gets overlooked in discussions about addressing climate change. I’ll publish the piece online after the print edition comes out, but here I wanted to talk about how you can access all sorts of interesting data online.
The need to do so arose because the publisher to whom I sent my op ed wanted to verify the figure I quoted for how much carbon dioxide the average commuter injects into the atmosphere each year. While I found a number of sources for the number I quoted, none of them showed how the figure was derived. A great opportunity to jump into the data trenches courtesy of Google!
My first find was EPA document 420F18008, Greenhouse Gas Emissions from a Typical Passenger Vehicle (2018). You can find it by searching for the document number at the EPA site (The agency uses a fairly oddball way of presenting documents on the web so I can’t just give you a link to it). It contains key information, like the grams of carbon dioxide produced by a gallon of fuel, the average fuel efficiency of passenger vehicles on the road, etc. What it doesn’t have is information on how long the commutes are in various parts of the country. Instead, it uses national averages.
But it turns out the US Census Bureau has the commuting information available. In fact, it has tons of really neat information available, and offers some cool analytical tools to boot. And it’s accessible through a searchable map interface. All you have to do is enter the census area you want to work with (e.g., San Mateo County) and then select the type of data you want displayed or analysis you want done (I used jobs by distance). You’ll get back something like this:
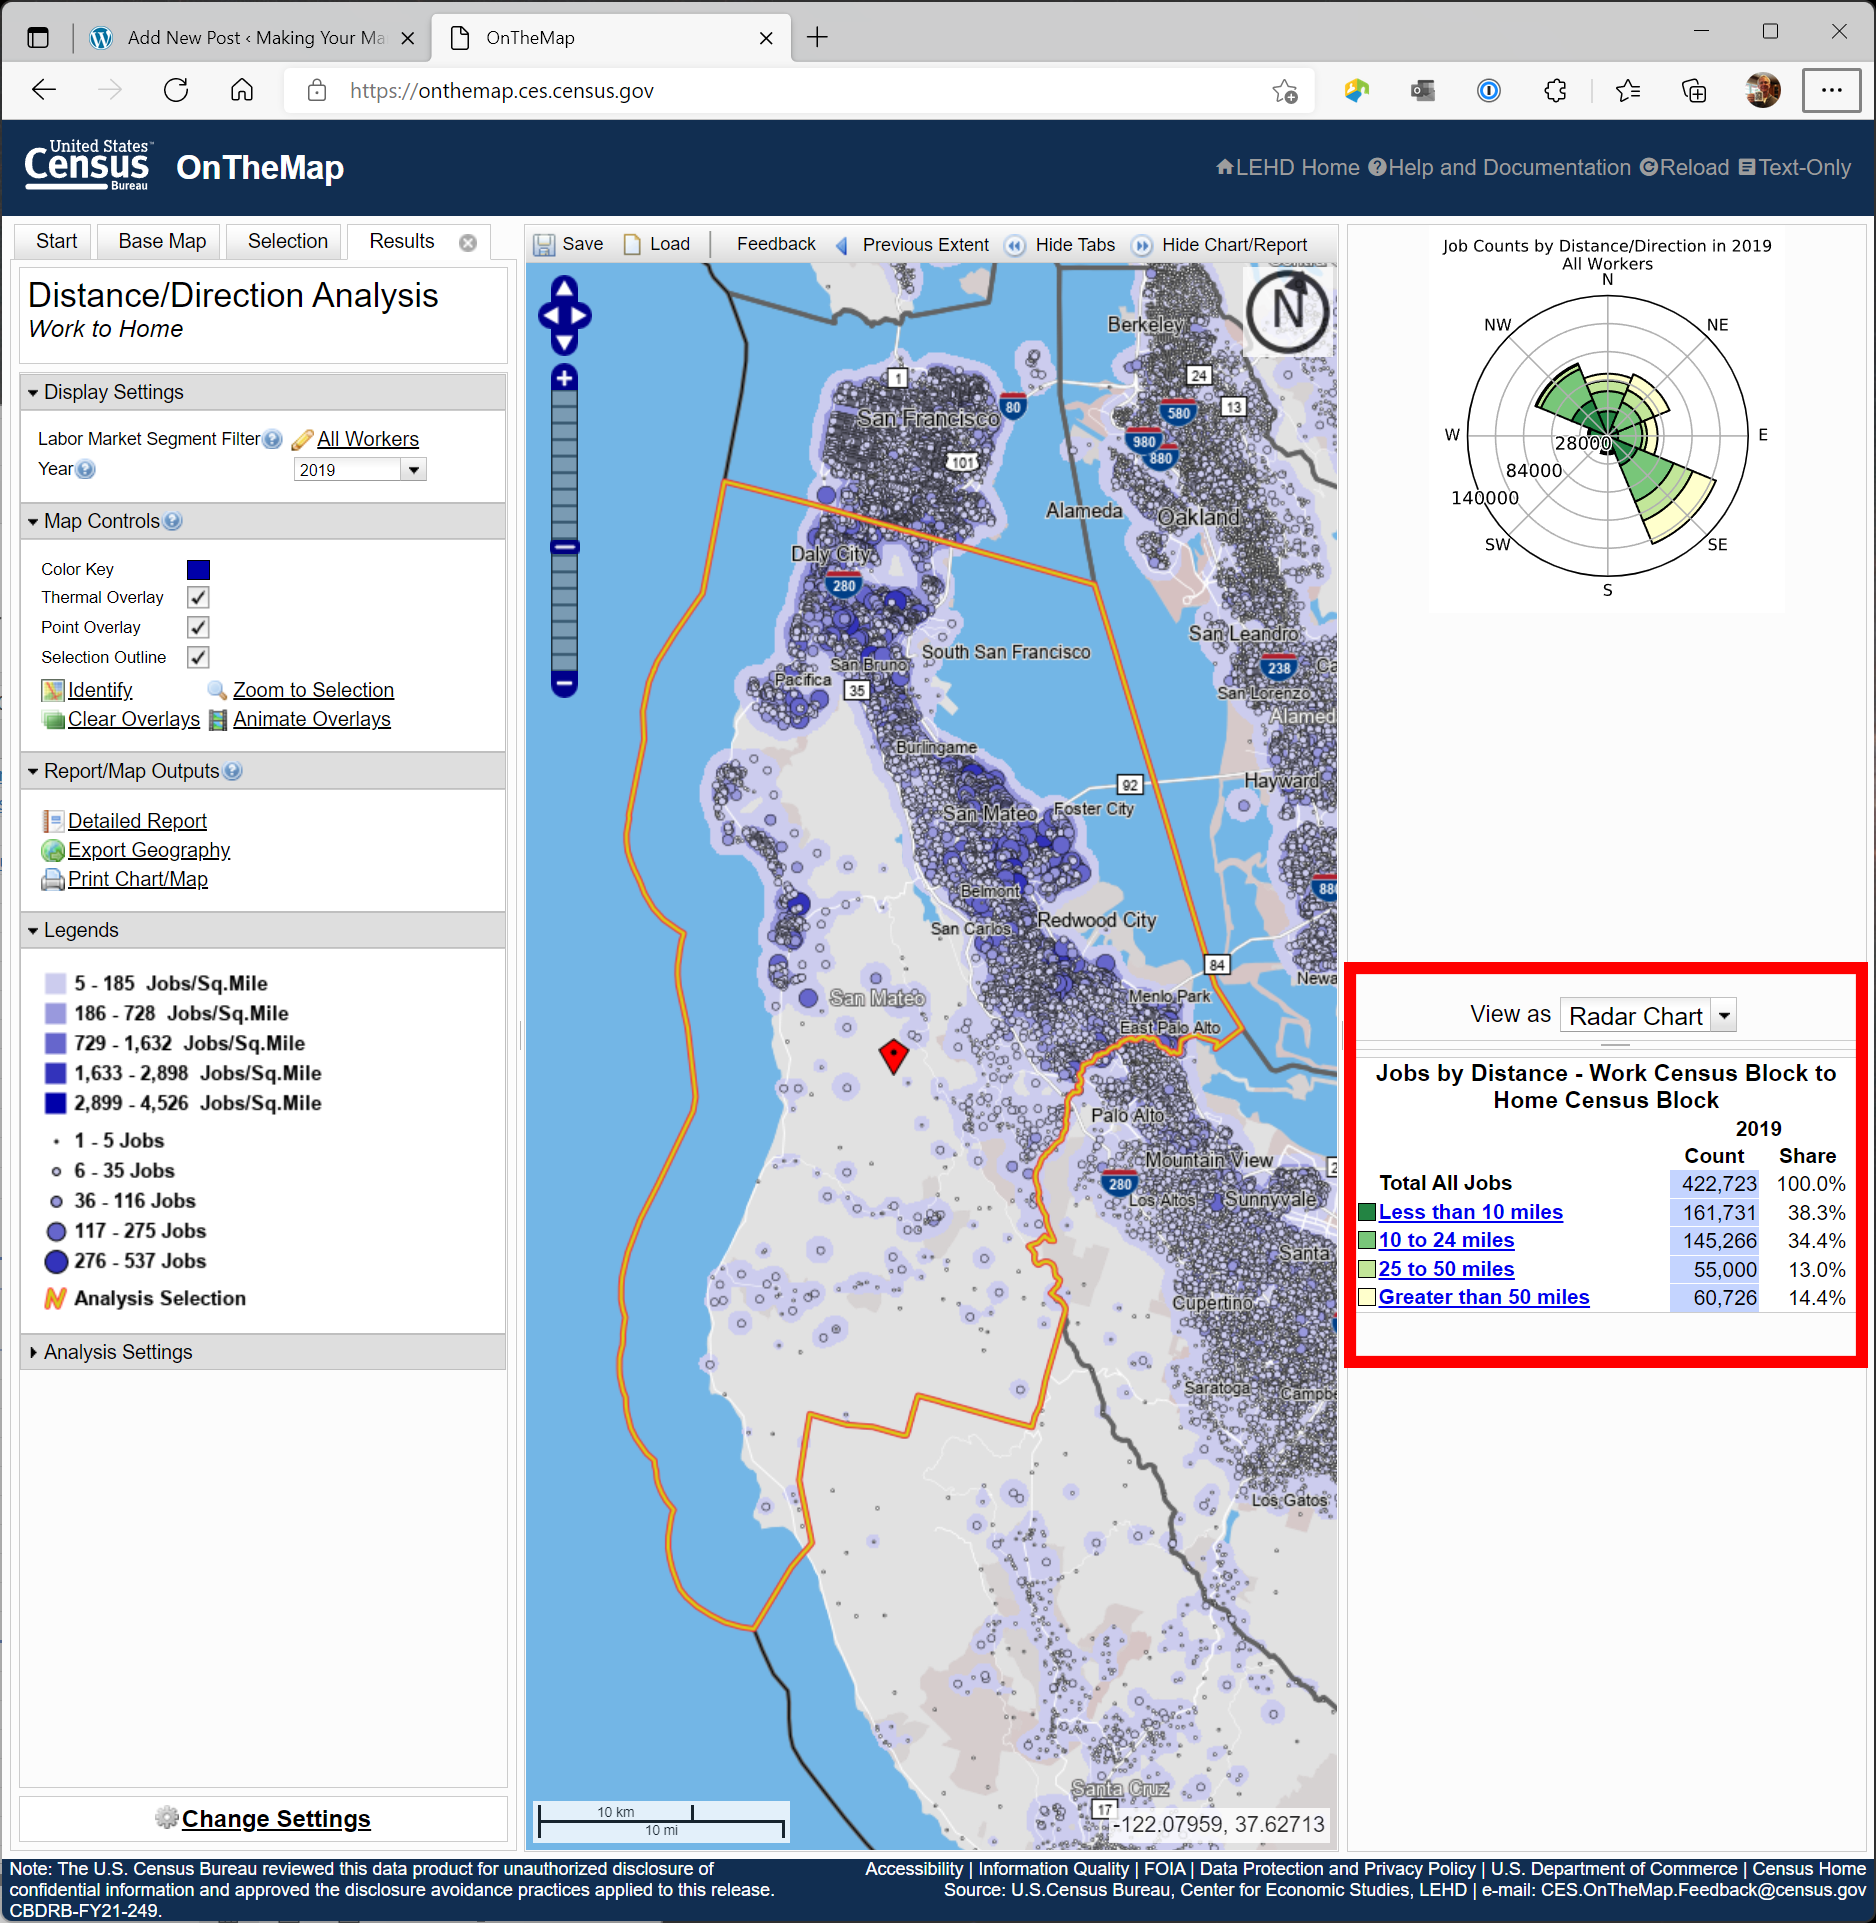
The commute distance data is in the red highlighted box1. You can see that in 2019 34.4% of San Mateo County commuters drove between 10 and 24 miles to get to work.
Adding in some data on how commuters get to work (e.g., by driving alone, in a carpool, etc.), doing a little arithmetic and voila! You have an answer on how much carbon dioxide commuting puts into the atmosphere every year.
Which for the nine Bay Area counties works out to be about 3.5 tons per commuter. That’s a lot more than I expected!
but note the radar map above it; they actually keep track of what direction people are commuting! ↩